1. Background
The photovoltaic system circuit includes two parts: MPPT and inverter. Among them, MPPT locks the maximum output power of the photovoltaic panel through a power tracking algorithm, while the inverter completes the synchronization between the photovoltaic system and the grid. In both parts, current sensors play a key role in protection and control functions. With the significant reduction in the cost of SiC devices, their use in photovoltaic systems has shown explosive growth. Compared with the original Si MOSFET or IGBT, SiC MOSFET has better switching characteristics, which enables the system to adopt higher switching frequencies and significantly reduce the size and cost of energy storage components such as inductors and capacitors. However, higher switching frequency also means that the current ripple frequency is increased, which puts higher requirements on the bandwidth and transmission delay of current sensors. This series of articles will quantitatively analyze the impact of current sensor performance on photovoltaic system functions based on this change, and provide theoretical guidance for practical engineering selection and application. This article focuses on the impact of current sensor performance in MPPT circuits.
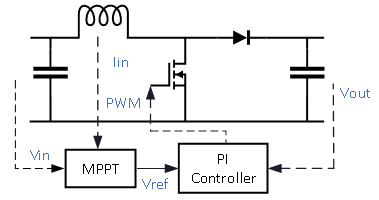
The common MPPT circuit topology is shown in the figure below. The circuit adopts a Boost topology, and the output voltage can be controlled by controlling the duty cycle of the switching device. In terms of control, the input voltage and current are used to calculate the power of the photovoltaic string, and then the MPPT algorithm gives the output reference voltage Vref to track the maximum power point, and then the output voltage is closed-loop controlled to obtain the drive control signal. In the MPPT circuit, the current sensor is usually connected in series with the power inductor to provide the inductor current signal. This signal supports the following two functions:
- Calculate the output power of the photovoltaic string for the power tracking algorithm;
- Monitor the inductor current to realize overcurrent protection.
This paper mainly considers two performance parameters of current sensors: bandwidth and transmission delay. The bandwidth of the sensor limits the gain of high-frequency current, and also causes signal distortion at the edges. The transmission delay represents the delay from the current being sensed to the current signal being transmitted to the system.
2. Introduction to Simulation Model
In order to compare system performance under different parameters, a photovoltaic system model is built in Matlab/Simulink for study and comparison.
2.1 Photovoltaic System Model
The photovoltaic system model refers to the Matlab example “Photovoltaic Inverter with MPPT Using Solar Explorer Kit”, including photovoltaic panels, MPPT, single-phase inverter circuit and its control sampling module. To simplify the model, the inverter circuit is replaced by a load string. The power tracking adopts the perturb and observe (P&O) method, with a perturbation value of 0.2 and a perturbation frequency of 60 Hz.
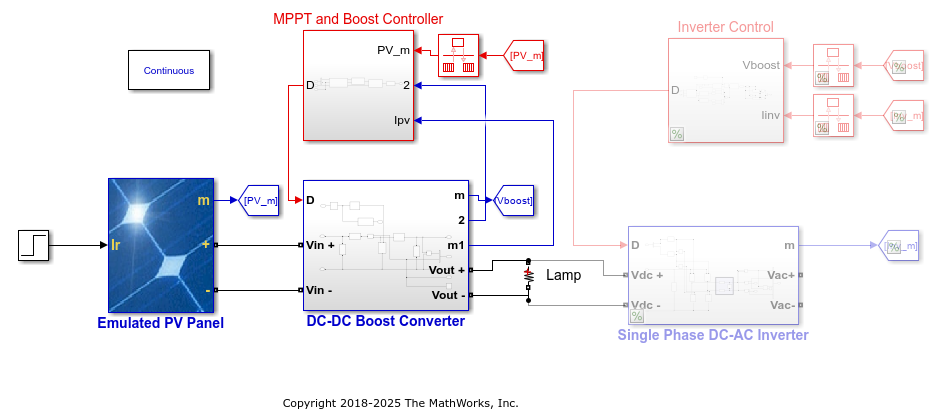
The Boost circuit is shown in the figure below, and the relevant parameters are set with reference to the actual circuit. The switching frequency is set to 60 kHz to simulate the working state of SiC MOSFET. The current sampling method is synchronous sampling, that is, in each cycle, sampling is performed at the midpoint of the rising edge and falling edge of the inductor current and averaged.
2.2 Current Sensor Model
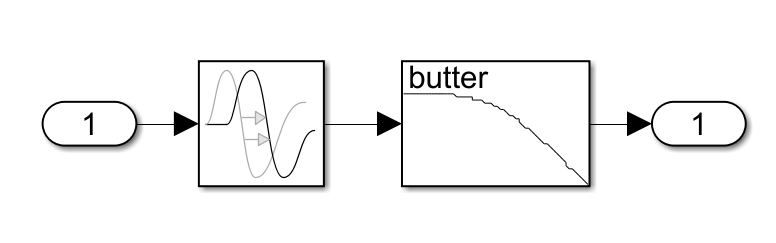
In order to reflect the bandwidth and delay characteristics of the current sensor, a transfer model is established as shown in the figure.
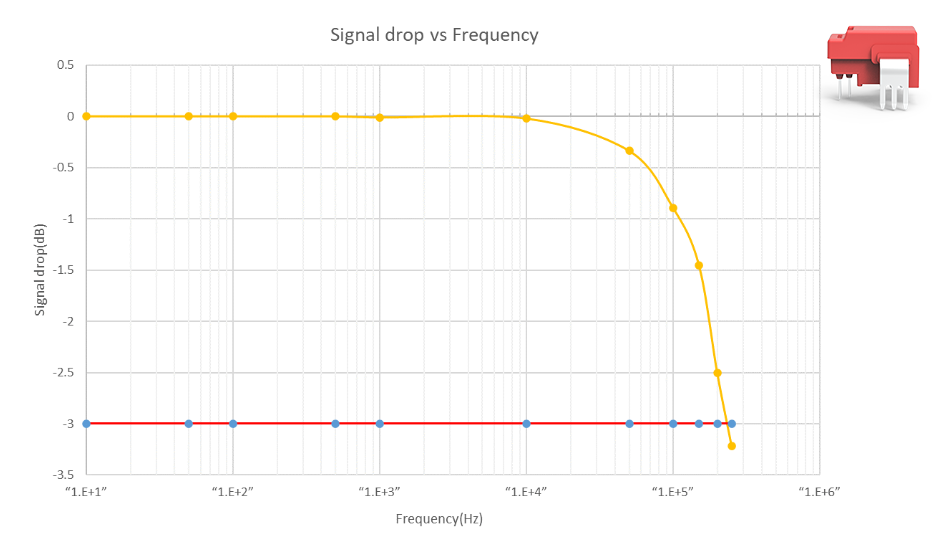
Among them, the analog low-pass filter is designed as a first-order Butterworth filter, and its bandwidth is the set bandwidth of the current sensor. Referring to the frequency response test curve of the Magtron MG20RAG open-loop Hall sensor shown in the figure, it can be seen that its amplitude-frequency curve conforms to the characteristics of a typical first-order low-pass system, so it can be fitted with a first-order Butterworth function.
3. Simulation Test
In this experiment, the temperature condition is fixed, and the irradiance is stepped from 0.4 to 0.5 to observe system characteristics. Different combinations of transmission delay and bandwidth are scanned. After simulation, the output power of each group of parameters is recorded. The instantaneous power is calculated by the product of photovoltaic voltage (VPV) and current (IPV), that is, P = VPV × IPV. The images are exported to analyze and compare the differences under different delays and low-pass filter bandwidths.
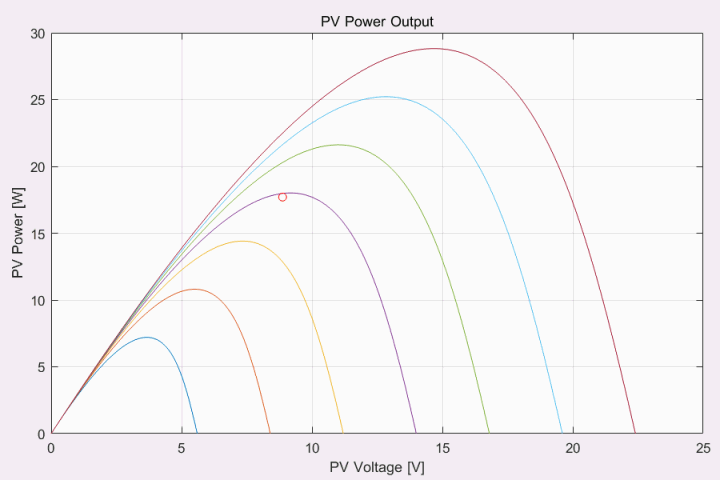
The photovoltaic output power curve of the system under test is shown in the figure below, which shows the MPPT tracking effect under different irradiance.
Frequency response scanning is performed on the system to analyze its characteristics. A sweep signal is injected at the current sampling port, and the output response is the system output power. The system Bode plot is obtained as follows.
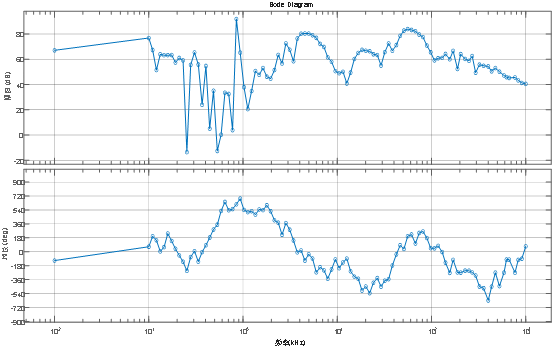
From the Bode plot, it can be intuitively seen the influence of current components at different frequencies on the system output power. It can be seen that from 100 kHz, the magnitude of the frequency response decays at a slope of 20 dB, indicating that the influence of high-frequency components on power gradually weakens in the high-frequency range. The introduction of the current sensor is equivalent to adding a low-pass filter to the ideal system, which is reflected in the Bode plot as adding a pole, reducing the system crossover frequency and increasing a 90° phase shift. It should be noted that the system response is also affected by the voltage loop, and different control loop schemes will produce different pole-zero distributions.
3.1 Bandwidth Impact Analysis
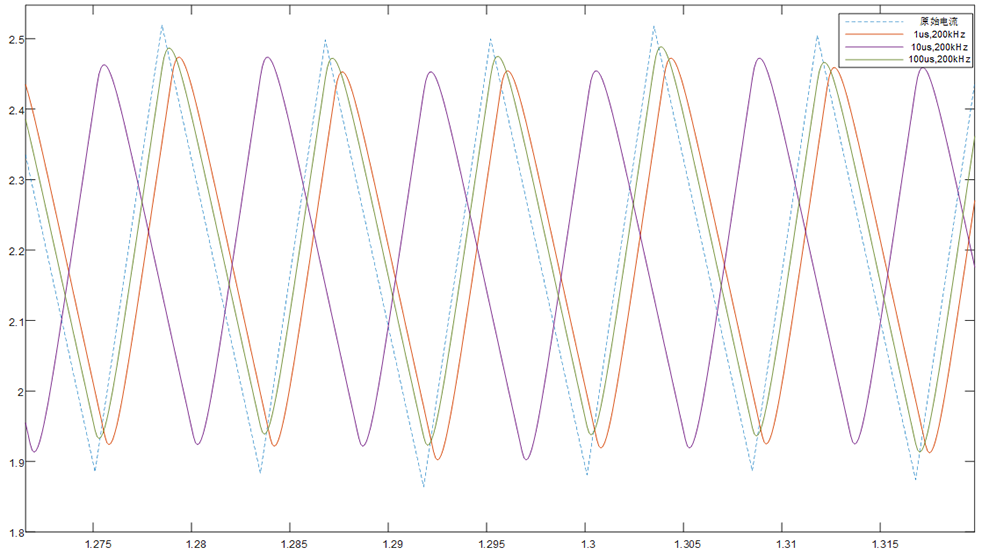
First, current sensors with different bandwidths are used to process the inductor current waveform, and the influence of different bandwidth settings on waveform distortion is observed. The bandwidths are set to 400 kHz, 200 kHz, 100 kHz, and 10 kHz respectively, and the waveforms are as follows.
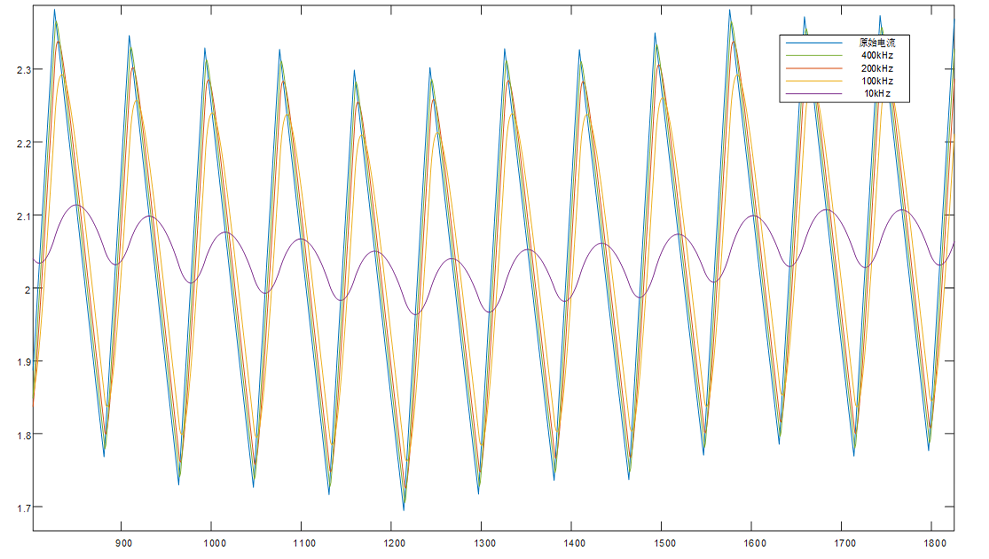
As the bandwidth decreases, two changes occur in the current sensor output. One is that the waveform peak distortion gradually increases. This is because the inductor current is a triangular wave, and the attenuation of its high-frequency components produces spike distortion. The second is that the waveform delay gradually increases, which causes the current sampling point to fail to accurately fall at the midpoint of the triangular wave.
If real-time detection of the inductor current peak is required to avoid overcurrent caused by inductor saturation, insufficient bandwidth will have a greater impact due to peak distortion. However, for most products using average current detection, this distortion will not have a significant impact. This is because the controller bandwidth of the system is generally only 1/5 to 1/10 of the switching frequency, so the fluctuation frequency of the average current is low and will not be attenuated by the current sensing. Moreover, synchronous current sampling itself is equivalent to averaging filtering, so the attenuation of the peak has almost no effect on average current detection.
However, synchronous sampling is greatly affected by waveform delay, because the sampling point shift caused by delay will cause deviation between the measured average current value and the actual value. The more the PWM duty cycle deviates from 50%, the larger the deviation. In addition, when the waveform delay is large enough to shift the sampling point to the previous cycle, the sampled average current will also be delayed, resulting in power calculation deviation and slower overcurrent protection response.
The MPPT power curves under different bandwidths are shown below.
Among them, the curves of 400 kHz/300 kHz and 200 kHz/160 kHz completely overlap.
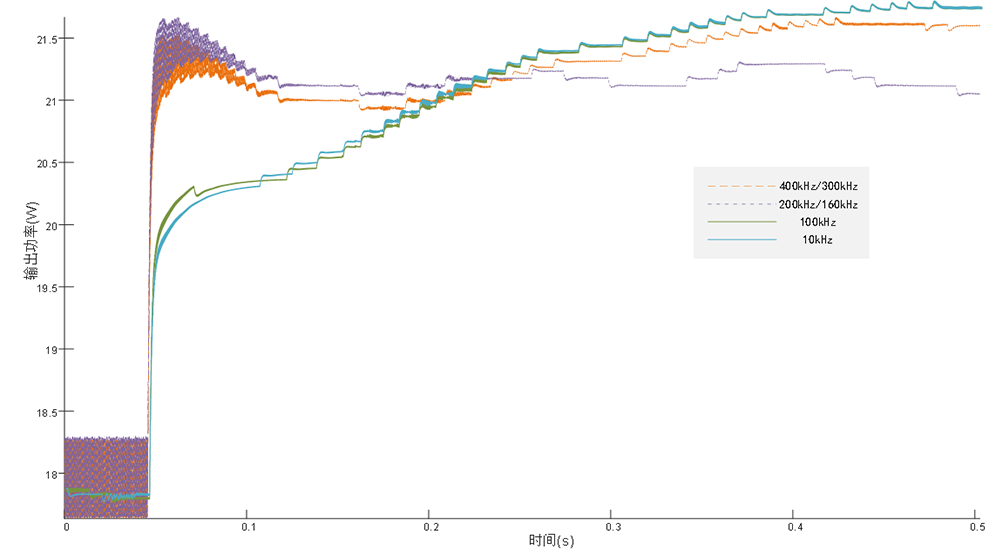
The analysis can be carried out from both transient and steady-state characteristics.
From the transient response waveform, it can be observed that as the sensor bandwidth decreases, the system overshoot first increases and then decreases. The system overshoot is inversely proportional to the phase margin, that is, the distance between the system phase and 0° (-180°) at the crossover frequency. The change in overshoot should be due to the low-pass effect of the sensor shifting the system crossover frequency, thereby changing the phase margin.
Different bandwidths also have a certain influence on the steady-state value of the system. Ignoring the steady-state error of the control system, the average current sampling error caused by waveform distortion should be the main reason for the difference in steady-state values. Due to measurement error, the calculated maximum power point of the photovoltaic string may not be the true maximum point, resulting in MPPT tracking error. However, this error is relatively small. The steady-state value at 400 kHz differs from that at 10 kHz by only about 1%. The 200 kHz/160 kHz cases have not reached steady state at the end of the simulation due to large overshoot.
In summary, current sensor bandwidth has a greater impact on system transient performance and a smaller impact on steady-state performance. By designing the system crossover frequency to be much lower than the sensor bandwidth, the transient performance can be made unaffected by the sensor.
3.2 Delay Impact Analysis
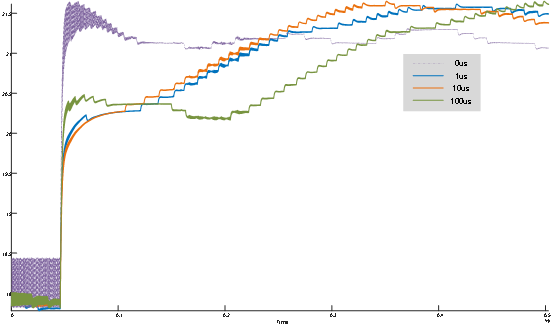
Next, with the sensor bandwidth fixed at 200 kHz, different transmission delays are applied to sample the inductor current waveform, and the results are as follows. The influence of delay on sampling has been described in the previous section and will not be repeated. It is worth noting that when the delay reaches 100 μs, the current waveform is delayed by approximately one switching cycle, making it appear as if the delay is minimal.
The power curves under different delays are shown below.
In general, delay only changes the phase response of the system and does not affect the magnitude response. However, due to the current sampling error caused by delay, the steady-state value of the system also changes slightly. From the waveform, as the delay increases from 1 μs to 100 μs, the system phase margin decreases, which is consistent with the theory that delay increases phase lag. However, in terms of overshoot, the no-delay case is the most severe. It can be inferred that the phase margin is extremely small in the no-delay case. After adding delay, the phase lag causes a phase crossover, which instead increases the phase margin. However, this crossover still affects system stability.
In summary, the smaller the current sensing delay, the better, but it is also affected by system frequency characteristics.
4. Conclusion and Application Recommendations
According to the simulation results, the bandwidth and delay of current sensors will have a certain impact on MPPT overcurrent protection and power tracking. When the sensor bandwidth is much greater than the system crossover frequency, its impact on the system magnitude response can be ignored. In this case, pursuing higher sampling bandwidth is essentially pursuing smaller sensor transmission delay to avoid increased sampling error and reduced system phase margin. Relatively speaking, the impact of current sensors on power tracking is small, but it has a greater impact on systems requiring fast overcurrent protection.
In practical applications, to avoid errors in average current calculation under synchronous sampling, it is recommended to select current sensors with as small total delay as possible. If the steady-state PWM duty cycle of the system is D and the switching frequency is fS, the total sensor delay is recommended to be less than min(D, 1-D) / 2fS to avoid sampling delay. In this case, the sampling error caused by delay can be corrected by compensating the sampling time. It is also recommended to reduce the system bandwidth as much as possible to reduce the impact of system delay, including sensor delay.

Magtron is committed to the research and development of magnetic sensing and control chip technologies. For different application scenarios, we have developed a series of products covering a frequency range of 0~2 MHz, providing customized solutions for photovoltaic, industrial production, and new energy equipment. We accurately capture current signals, ensure stable equipment operation, and provide high-precision, highly adaptable, and cost-effective current sensing and control solutions.